Category Archives: Office

Use PowerPoint QuickStarter to Research a Topic

PowerPoint QuickStarter template builds an outline based on your requested subject and the slides you select to help you get started researching that subject.

Note: QuickStarter is only available in Office 365 (subscription) PowerPoint.

Bike racers represent PowerPoint Quickstarter

Create QuickStarter Template

To create an outline with QuickStarter template:

  • In PowerPoint 2016, select File > New. Then select the QuickStarter template:

QuickStarter Template

  • If you haven’t already turned on Office Intelligent Services, a dialog box displays asking you to do so. (Intelligent Services needs to be turned on to use QuickStarter).

Intelligent Services dialog box

  • Specify a subject to search on, or choose from a popular subject shown at the bottom of the dialog box.

QuickStarter Search options

I typed “Create a Marketing Report” in the Search box and then clicked on Social media marketing tile:

QuickStarter suggested categories

QuickStarter then gathers information and presents you with a list of subjects related to your search topic.

Note: If you see inappropriate content, move your mouse pointer over it, click the more (…) command in the upper right corner of the icon, and select Report inappropriate topic.


I like all the content for my Social Media topic, so left all slides selected.

Create Your Presentation with QuickStarter

Steps to complete the presentation from the template:

  1. All the subjects may be selected by default but you can just select the boxes for topics you want to include in the outline that QuickStarter will assemble for you.
  2. Click Next to confirm the list of subjects you’ve selected to include in the outline. (Each topic you selected becomes a slide in the outline.)
  3. Choose a design for the slides in the presentation, and then click Create. (Don’t worry about the lack of selection here, you can change the look later).


  1. PowerPoint 2016 puts together your outline presentation and opens it for you.
  2. Look over the outline and start doing your research. Use the key facts (on slide 1) and related topics (slide 2) for ideas as you research and write about your topic. (Also, there may be additional information, such as a Summary, in the Notes below the slide).


Note: There may or may not be pictures on your slides, depending on the subject you chose. You can add, remove or change any of these.

The QuickStarter outline includes:

  • Two slides of information gathered from online sources:
    • The first slide lists key facts on the slide and in the Notes pane below the slide.
    • The second slide lists related topics for you to research. (These two slides are just for you, so they are hidden from view when you present your slide show to others.)
  • A title slide.
  • A table of contents, based on selections you made.
  • A slide for each subject, sometimes with additional suggested points in the Notes below the slide.
  • A concluding slide, “Works Cited,” where you list the sources of information you used for research.

Any Images included in the outline are public domain or licensed under Creative Commons.

Research Information Online with Smart Lookup

The first slide in the presentation is, “Here’s your outline.” It includes a summary about the topic, and usually includes dates and other kinds of useful information. Any paragraph on the slide that displays an ellipsis (…) is repeated in full in the slide Notes below.

The Outline is a great guide but you’ll want to fill in the holes in your subject details. The second slide in the presentation is “Related topics.” which lists terms you can use for research. Smart Lookup returns definitions and search results from Wikipedia and related websites.

Use the Smart Lookup feature to expand on related topics from Slide 2:

  • In Slide 2, right click a word or phrase you want to research.
  • Click on Smart Lookup to display search results in a task pane to right of your slide.


  • Insert any desired information.

Other slides in the presentation are suggested topics (based on the subjects you chose originally). Some slides may include “Consider talking about” points in the Notes pane on that slide.

Designer Feature for Design Ideas

To add variety to the look and feel of your presentation, open Design Ideas by going to Design tab, Designer group and click Design Ideas.


Click on a slide to display different design layouts for the text and images on that slide.

You can also use all the normal design features available in all presentations.

Celebrate your masterpiece!

No excuse anymore for not having a stunning presentation with captivating data. If you use PowerPoint at all, this feature alone is worth switching or upgrading to Office 365.

What do you think about this new feature? Let me know in the Comments below.
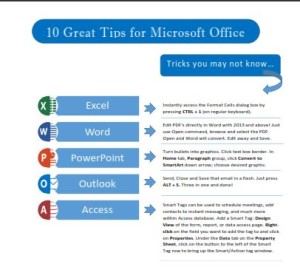

Insert a Watermark on Selected Pages in Word

A Watermark is inserted on all pages by default but sometimes you want it only on selected pages or only on one page. The steps below will accomplish both these tasks. For steps to display a text or image watermark on all pages, see the link to a previous blog for watermarks below.

Example of transparent Word Watermark

Add a Watermark Only to Selected Pages

By default, Word documents are all in the same section (Section 1), regardless of the number of pages you create. This applies the same page layout, margins etc., across the board. If you want different headers or footers, margins or layout for one or more of the pages, the trick is to create section break(s)

Add a watermark only to particular pages by creating a section break. You can then apply a watermark only to that section. Sections are linked by default so you need to unlink them, before inserting the watermark or sections will automatically copy each other.

Place the cursor on the page (after the section break) where you want the watermark to appear:*

  • On the Design tab, in the Page Background group, choose Watermark

Insert Watermark from Word Ribbon

  • Select a watermark from the displayed gallery or create a custom watermark (covered in previous blog, link below).

Add a Section Break

There are several choices when creating a section break but they are all located in the same drop down list:

  • Click the Layout tab, and in the Page Setup group, choose Breaks.
  • Choose the type of section break you want:

Word Section Break Options from Micosoft

If you are not familiar with the details of section breaks, they can vary with the different versions of Word. See this Microsoft web page for excellent steps for each:  Microsoft support for section breaks in Word

Add a watermark to a single page

You can add an image or a text watermark such as Confidential to a single page in a document:

  • Place your cursor on the page that needs the watermark.
  • On the Design tab, in the Page Background group, choose Watermark.
  • Right-click on any watermark in the watermark gallery and choose, Insert at current document position.

The selected watermark is inserted only on a single page.

Remove a Watermark

  • Click on the Watermark icon (Design tab | Page Background group).
  • Click Remove Background.

It is done!

NOTE:  If you are in the Watermark dialog box, you can remove the watermark by clicking in No Watermark at the top.

For the basics of inserting custom watermarks, see this previous post:  https://gaylelarson.com/insert-watermark-in-word/

Insert a Watermark in Word

What is a Watermark?

A Watermark is text or a picture placed behind the content in your document as a faded background. You can add a text watermark, such as Draft or Confidential or Do Not Copy to your document (these are already included in the Watermark Gallery), or you can create your own custom watermark, such as “Property of…”, etc., or insert a picture or company logo for your document.

Not only is this a great way to protect your intellectual property, it is also a good way to “brand” the document with your company logo or any desired text or graphic.

Example of Watermark (Washout) in Word Document

Add a Text Watermark from the Gallery

In the beginning, the steps are the same whether adding text or graphic:

  • On the Design tab, in the Page Background group, choose Watermark

Ribbon Page Background group for Word Watermark

  • The dialog box will display with built-in text options:

Built-in Word Watermark Text Gallery

  • Choose one of the built-in watermarks in the displayed gallery or add one of your own by clicking Custom Watermark… (see below for steps).

Word automatically applies the watermark to every page (except a designated cover page).

Add a Custom Text Watermark

  1. Click the Design tab, Page Background group, Watermark.
  2. Choose Custom Watermark.
  3. Select Text watermark and the options will change to allow you to type your custom text, choose the font, size and color, and if you want it displayed diagonally or horizontally. (Tip: Leave the size on Auto as Word will adjust to appropriate size for page).
  4. Semi-transparent should be auto selected but if not, check it.

Custom Text Watermark dialog box

Add a Picture Watermark

  • Click the Design tab, Page Background group, Watermark.
  • Choose Custom Watermark.
  • Select Picture watermark, and then choose Select Picture.

Picture Watermark dialog box

  • Select the picture that you want, and then choose Insert. (Note the options to search for an image online or use an existing image from your storage sources).

Insert Picture Options for Word Watermarks

  • The Washout box should be checked automatically but, if not, click it to lighten the picture so that it doesn’t interfere with your document content.
  • You are back in the dialog box where you can choose Apply to see what it looks like on the page and make changes, if needed. Note the Scale box that is set to Auto. If you want to increase or decrease the size of your graphic, choose from the 0% to 500% options in the drop down list.
  • When satisfied, click OK and Print Preview your document to see it WYSIWYG (Geek speak for: What you see is what you get).

NOTE: You can turn any picture, clip art, or a photo into a watermark that you can use to brand a document.

Remove a Watermark

This one is simple pie:

  • Click on the Watermark icon (Design | Page Background).
  • Click Remove Background.

Done…Don’t we wish all of life were this easy!

NOTE:  If you are in the Watermark dialog box, you can remove the watermark by clicking in No Watermark at the top.

Want to add a watermark to selected pages only or to a single page? This is a little more complex and we’ll cover that  here: https://gaylelarson.com/insert-a-watermark-in-word-part-2/

What watermarks have or will you use? Let me know in the Comments below. Thanks for reading!

Use Excel Sparklines Instead of Charts to Display Data Trends

What are Sparklines?

Sparklines were introduced in Microsoft Excel 2010 and add a quick way to display results without having to insert an entire chart object. A sparkline displays a visual representation of data as a tiny chart inside a single cell, and can be used to show trends in a series of values, such as sales for a company, products, sales representatives, time frames, economic cycles, or pretty much anything that has discernible increases or decreases.

Is a Sparkline a Chart Object?

The tiny sparkline chart actually resides in the background of a cell and displays a separate result in each cell for the range selected, unlike the chart object that displays all results in a single chart, such as a column, bar, pie, or a myriad of other chart types.

There are three different sparkline chart types, found on the Insert tab:

Sparklines Group

Create a Sparkline Chart

Because sparklines live in the background of a cell, you can insert them anywhere on your worksheet. However, people wouldn’t have a clue what they were supposed to represent as the Formula Bar is blank for any cell that contains a sparkline, unless you enter something else in the cell. Ergo…Best to put them next to your data.

Sparklines are automatically grouped by default but you can ungroup them to treat the cells separately. When you insert the chart, you can click in the first cell where you want the chart, and then select the rest of the range when inside the dialog box, or easier method, select the range first, and it will be auto displayed in the box:

Range to insert Sparklines

Click Insert tab to display the dialog box. If you have selected all the cell references for results, the Location Range is filled in and the Data Range: box is waiting for you to select the value cells:

Create Sparklines dialog bocx

Select the full range with the mouse of the values you are charting (in this case, B4:E8):

Data range for Sparklines

Click OK to insert the mini-charts.

Line Sparklines inserted next to data

Note: If you only selected the one cell, F4, when you inserted the sparkline, you can use the Fill Handle to populate the rest of desired cells. (You must drag the handle down though as the double click shortcut will not work here).

The Design Tab for Sparkline Tools

You don’t have all the fancy trappings of actual Excel chart objects but, hey, these are pretty spiffy and sometimes can even get the picture across in a clearer manner. The Sparkline Tools tab gets added to the end of the Ribbon and gives you many options for editing and formatting those little gems through the Design tab.

Sparklines Tools Design tab on Ribbon

You probably noticed that no markers displayed on the line charts but you can easily add them. (They are available only on this chart type). In the Show group, just click in the Markers box, and there you go – a marker for each change in value. Now you can use the Style group to choose a quick color change or individually change the Sparkline Color or Marker Color. (See below). Individual markers are also available for any chart type to represent High, Low, Negative, etc., in the Show group.

You can apply a color scheme to your sparklines by choosing a built-in format from the Style gallery or change your chart type from the Design tab (available when you select a cell that contains a sparkline). You can use the Sparkline Color or Marker Color commands to choose a color for the high, low, first, and last values (such as green for high, and orange for low).

Whatever selections you make are applied to all the sparkline cells as they are grouped by default. If you want to personalize a particular cell, or all cells individually, they can be ungrouped, and you can also type a comment directly in the cell without deleting the chart.

Ungroup Sparklines

Ungroup all the sparklines by selecting  that range, and choosing Ungroup from the Group group. (I’m not stuttering, honest)! If you just want to personalize one cell, select it, and choose Ungroup.

Sparkline cell with text entry

Using Sparklines for Stock Performance

This image shows a column sparkline in cell F2 and a line sparkline in F3. Both of these sparklines get their data from cells A2 through E2 and display a chart inside a cell that shows the performance of a stock. The charts show the values by quarter, highlight the high value (3/31) and the low value (12/31), show all the data points, and show the downward trend for the year. The high value marker is green, and the low value marker is orange. All other markers are shown in black.

Stock Performance Sparklines

Cell F6 shows the 5-year performance for the same stock, but displays a Win/Loss chart that shows only whether the year had a gain or a loss. This sparkline uses values from cells A6 through E6.

Sparkline Benefits

Sparklines can be inserted next to the data and take up such little space. They also easily point out a pattern. Any edits to your data automatically update the chart so the changes to trends are instantly represented. They can be inserted for rows or columns of data, and type changed with a mouse click.

*Stock Performance image from Microsoft

Find Sparklines fascinating? What would you use them for? Leave a comment below!

If you like different graphical ways of displaying your data, check out my blogs on using the Camera tool in Excel:

Part 1… https://gaylelarson.com/use-excel-camera-tool-combine-objects-several-workbooks/

Part 2…https://gaylelarson.com/excel-camera-tool-part-2/

Hide Slide Parts in PowerPoint

Hide PowerPoint Slide Objects

Sometimes you have a part or parts (objects) on a slide that you want to use again but that box (placeholder) information doesn’t apply to a current situation. You could create a duplicate slide and delete or edit the information but PowerPoint has an easier solution.

Available in PowerPoint 2007 and above.

Hiding PowerPoint Slide objects

Use the Selection Pane to Hide Slide Parts

This feature is especially helpful if this is a slide presentation that is used frequently. No messing around with deleting or duplicating. Here’s how to hide objects on the slide until you need to use them again:

  • On the Home tab, Editing group, click the drop down arrow on Select
  • Choose Selection Pane…

A task pane displays on the right side of your slides (can be dragged to left side if you prefer)

The elements (placeholders) will be listed for the current slide (shown here in example), and identify Title, Shapes, Pictures, Slide numbers, text boxes (anything that is an object). You can also rename the objects in the Selection Pane to make it clear what they represent.

Example of Show/Hide PowerPoint object with Selection Pane

Use the Icons to Display and Hide

I don’t want the “Free through Saturday!” to display on the slide currently but will use it later so don’t want to delete the placeholder:

  • Click on the placeholder border in the slide to select that text box which will automatically highlight its item name in the Selection Pane. (You can also click its item name in the Selection Pane and the box will be selected).
  • Click the eye icon to the right of the item name.      Use the eye icon to show/hide PowerPoint slide objects
    • That placeholder is now hidden and the eye becomes a line.
  • Click the line to display the object on the slide again.

You can hide/display any parts of a slide without editing. PowerPoint will accommodate with the Selection Pane details as long as it can identify as an object.

Note: The slide image example above represents an actual eBook of mine available on Amazon as shown. However, it is not free, so if this was an actual slide presentation, I would remove that placeholder. If you would like to be notified of any free promotion, just fill out the signup form on this page and get a free cheat sheet of Office tips while you wait!

If you are doing narrations, creating video or using PowerPoint for teaching or demonstration, take a gander at my blog for using Office Mix to take your PowerPoint to a new level.       https://gaylelarson.com/share-powerpoints-office-mix/

Have you played with the Selection Pane? How are you using this feature to organize slide presentations?  Thanks for reading and comment below.

Save Word Document as PDF

Save an Office Document in PDF Format

PDF format is the perfect solution for a Word or other type of Office document when we don’t know if the intended viewer has MS Office, or we don’t want them to be able to change our content. Saving as a PDF allows opening, viewing, printing and saving but not editing our original (except for last couple of versions of Word – see note). *

Word file as PDF

You can use the File | Export | Create PDF/XPS Document command from the Ribbon or the Save As dialog box to create in PDF format. Both methods have the same result but use a little different path to get there.

If you want just a portion of your document to be saved as a PDF, select that section before you publish or save as a PDF. It is also a good idea to save as a regular Word document before creating the PDF. Just sayin’…

Export as a PDF Document

Create your PDF from the File tab:

Click File | Export and click Create the PDF/XPS icon on lower right

Word File Export Create PDF/XPS Document

This displays the Publish as PDF or XPS dialog box:

Publish as PDF dialog box

  • Change the file name and location for saving, if desired
  • PDF is automatically chosen in the Save as type: box
  • The Open file after publishing box should be automatically checked
  • Click the Options… button for choosing to capture specific pages or a selection (if you highlighted previously) or for removing Document Properties which may contain sensitive information. Be aware it is checked by default.
  • Click the Publish button at the bottom to display the file in your default reader software (newer computers will have this automatically installed, such as Adobe Reader)
  • Close the PDF reader to return to your document

Save As Dialog Box for PDF

The F12 function key automatically brings up the Save As dialog box in all Office applications and then you can choose PDF as the format. This is the same as File | Save As but bypasses the Backstage and the extra steps:

Press the F12 function key to display the Save As dialog box

Save As PDF dialog box

  • Change the file name if desired
  • Choose PDF in the drop down in the Save as type: box
  • The Open file after publishing box should be automatically checked
  • Click the Options… button for additional choices (same as above)
  • Click Save when completed to display the file in your default reader
  • Create Save As PDF Shortcut on Quick Access Toolbar

If you need to create PDF’s on a regular basis, put a shortcut on the QAT. This is in two steps as you’ll create a shortcut icon for multiple formats, and then use that one for making a shortcut icon just for creating a PDF:

  • Right click on the Ribbon or Quick Access toolbar (QAT)
  • Choose Customize Quick Access Toolbar
  • Choose All Commands from the Choose commands from: drop down box
  • Wheel down to: Save As Other Format: (the one with the arrow at the right)
  • Click Add button and relocate position with arrow boxes, if desired
  • Click OK

Add Save as PDF format icon to Quick Access toolbar

Once back in your document, you can now create a PDF shortcut with the new QAT shortcut:

  • Click the drop down arrow on your new Save As icon on the QAT to see the list of available formats
  • Right click over PDF or XPS and choose Add to Quick Access toolbar
  • You now have icons for saving as a PDF and Save As other formats 

As you can see, there are several ways to get the job done. Whether you use Publish or Save As dialog boxes is a matter of preference but I vote for the PDF shortcut on the QAT for easy peasy!

*Note:  If you (or your viewer) has Word 2013 or above, PDF’s can be opened directly in Word as Word converts them to a regular document – a great feature but be aware if you have previously used PDF format specifically for document protection!

Saving in the PDF format is also a great way to preserve any special formatting or styles you created in the Word document. For instance, you might “brand” it with your logo or a text message as a watermark on all pages. If you want to explore that, take a look at this blog on Watermarks:  https://gaylelarson.com/insert-watermark-in-word/

You can save other Office files in PDF format as well. The Excel process is pretty similar to above but there are differences in PowerPoint, Access and OneNote and will cover those in a future post.

Have you saved PDF’s on a regular basis and used other methods? 

Copy and Paste Filtered Subtotals or Visible Cells Only in Excel

Copy and Paste Visible Cells Only (filtered data)

You have used one of several methods to hide some rows for filtered data, or created a table which auto applies filter icons for each column. Now you want to copy and paste just the visible data but discovered to your horror when you pasted to another location, it included the hidden rows!

Excel, Paste only Filtered Data

By default, Excel copies hidden or filtered cells in addition to visible cells. If you want only visible rows, here’s the steps:

  • Select the cell range that you want to copy.
  • Click Home tab, Find & Select in the Editing group and choose Go To Special
  • Click Special… button in the dialog box.
  • Click Visible cells only radio button and click OK.

Excel, Copy and Paste Filtered Cells Only

  • Click Copy in Clipboard group on Home tab (or press CTRL+C).
  • Click the upper-left cell of the desired paste area and click Paste (or press CTRL+V).

You have now achieved Nirvana!

Tip: You can also use the F5 Function key at Step 2 to bring up the Go To… dialog box and click the Special… button to get the same results.

Add the Icon for Select Visible Cells to the Quick Access Toolbar

Make this great solution even easier and faster by utilizing the Quick Access Toolbar (QAT):

  • Right click anywhere in the Ribbon and choose Customize Quick Access Toolbar… OR click the QAT dropdown arrow, and choose More Commands
  • From the Choose Commands From dropdown, choose All Commands.
  • Scroll down and click Select Visible Cells.
  • Click Add and then click OK to add to end of the QAT.
  • If desired, use the arrow boxes to change the icon’s position on the toolbar.

Now all you do is select the range, click the Select Visible Cells icon on the QAT, Copy and Paste – One and done!

Copy and Paste Only Subtotaled Rows

You’ve used the SUBTOTAL function to sum only filtered data and now want to copy and paste to another location. You assume the paste will include the visible subtotaled rows only – Surprise – not! You still need to use the Go To dialog box to accomplish this but if this is something you do often, apply shortcuts:

  • Select the range you want to copy. (Excel is actually selecting the hidden rows as well but this will get taken care of in the next steps).
  • Press F5 function key to display Go To dialog box.

Excel, Copy and Paste only Subtotaled, filtered Rows with Special...

  • Click the Special… button at the bottom of the dialog box.
  • Click Visible Cells Only to select only the visible cells in the selected range.

  • Click OK (or just hit ENTER key as OK is already selected).
  • Press CTRL C to copy the selected visible cells to the Clipboard.
  • Select a destination cell (can be on the same sheet, a different sheet, or on a new workbook).
  • Paste the range by pressing CTRL V. Excel copies only the subtotaled rows.

Now you can copy and paste only those cells or ranges YOU want.

Hope these tips have removed a little head-scratching from one of those features that we want to use on a regular basis but doesn’t always behave the way we expect!

Microsoft Snip, Windows Newest Screen Capture Tool

Snip Vs. The Snipping Tool

The new, free Snip tool takes the familiar Windows Snipping Tool that has been included in the Accessories folder of the operating system (in any version above XP) to a new level. While the Snipping Tool is a great screen capture tool and includes basic annotation and highlighting features, it lacks some capabilities found in Microsoft Snip.

Snip is one of several “garage” projects created by Microsoft employees who are being encouraged to create apps outside of the regular Windows and Office programs. How awesome is that! It is not included but can be downloaded free to Windows 7 and above. You can download it here and also see examples of how people use this tool: Download Here

Windows Snip, Show and Tell

Snip has three main steps of Capture, Annotate and Share and different ways to make that happen. A great feature is that it saves each capture in a Library so that you can use the snips again. It also allows voice recording, and saving as MP4 video.

Screen Capture with Snip

Once installed and opened, the dialog box will position itself at the top center of your window but you can drag it to any border or float it anywhere on your screen.

Activate a screen capture with the by clicking the Capture icon or pressing the PrtScrn keyboard shortcut which is automatically assigned.

Windows Snip, Print Screen key

You can click on the icons directly for the specific type of capture. The main menu is divided into three primary functions, Capture, Whiteboard and Camera.

Windows Snip, Capture toolbar

Snip Editor Toolbar

If the PrtScrn key is pressed or the Capture icon clicked and either the whole screen or a portion selected, the Snip Editor toolbar displays with options to record, annotate, highlight, and more.

Captures are automatically copied to the Windows Clipboard and any audio added will automatically be converted to a MP4 file. You can then embed on websites, play as video and/or save to desired location.

Windows Snip, Snip Editor toolbar

The Capture button can be used to get screen shots by either cropping the desirable section or by capturing the entire screen. The default selection is generally entire screen and can be captured with a click or by pressing Enter which displays the Snip Editor above.

Whiteboard is more like an extended paint tool and it will let you highlight and scribble and simultaneously explain what you are doing through voice recording.

Last but definitely not least, is the Camera capture button, which simply switches on your webcam and allows you to take a picture of yourself. Editing options are same for Capture, Whiteboard and Camera.

Note: The Record button records the annotations and other screen actions as well as any voice audio you use to explain your onscreen activity. The screen can be shared by email or saved to your hard drive.

Customize Options for Snip Tool

There aren’t many but you can control a couple of things from the Settings icon on the Snip Editor toolbar. If you don’t want the PrntScrn key to auto capture the screen, you can remove that shortcut. There is a delay feature but I haven’t found any reason to use it as, unlike the Snipping Tool, you can capture drop-down menus and dialog boxes by displaying them, then pressing the PrntScrn key (which is why I leave it active) – a huge advantage!

Windows Snip, Snip Editor Settings

Take a screenshot in Windows 10 and Windows 8

Windows 8 and 10 users can press the Windows and PrntScrn keys together to capture the entire screen and the image will automatically save to a Screenshot folder inside of the Pictures library. Earlier Windows versions copy to the Clipboard.

Take a screenshot on a Windows tablet or smartphone

Windows tablet owners can take a screenshot by pressing both the Windows button and Volumedown key at the same time. The image will auto save in the Screenshots folder in the Pictures library.

On a Windows 8.1 Phone, you do this by pressing the Power button and Volumeup key together. On Windows 8 phones, press the Start button and Power button at the same time. Screenshots are automatically saved in the Photos
Hub section

Summary

It is exciting to see Microsoft releasing these “garage” projects that are innovative and free. Although there are many other programs that can do the same or similar things to Snip, most are not free (definitely a bonus)! Other ventures from Microsoft include Sway (online creative graphics) and Mix for PowerPoint which you can download into that application. Along with the purchase of other programs such as Wunderlist and LinkedIn, there seems to be a move towards creative features that can be used in both Office 365 and Windows.

Want to try Mix? Go to my blog post on Mix here for more information: PowerPoint Mix on gaylelarson.com

Go here to see my previous post on the Windows Snipping Tool: Windows Snipping tool blog on gaylelarson.com

Have you played with Snip? What feature do you like best?

Display Results of Formula Inside Cell During Creation

Would you like to see the values displayed when you are entering a formula but a little fuzzy on how to make that happen?

Get clarity displaying formula values in cell

There are times when you may want to examine the results of a complicated formula from others or as you are creating one inside the cell. This can save time and frustration and avoid the dreaded error message after you hit ENTER or TAB.

If you want to look at the results of a particular part of a formula as you type, or after you or someone else has entered it, use a couple of function keys to complete the process.

Display Formula Values During Formula Creation

Here is a simple example of how handy this can be where we are adding sales of only two of the products, adding fees and dividing by cost, with the formula being entered in H9:

=(B9+E9)*G9/F9

Example displaying formula values in the cell

If I want to know the value of G9/F9 before completing the formula, I can do this directly in the cell.

  1. In the results cell (in this case, H9), type the formula.
  2. Select the part of the formula whose value you want to see. Here, it would be G9/F9.
  3. Press F9. Excel replaces that part of the formula with its result.

Selected portion of formula displays values

If this is the correct result, press ENTER or TAB, and Excel completes the formula and moves to requested cell. You could also press ESC to return to your formula and stay in the cell. Be careful here. If you are creating, not editing a previous entry, ESC will revert to whatever the cell contents were prior to your entry (such as a blank cell).

Display Formula Values Editing Existing Formula

If the formula already exists and you want to display the value, the steps are the same except you need to be in Edit mode in the cell:

  1. Click in the cell and press F2 to edit the formula in the cell. *
  2. Select the part of the formula whose value you want to see (G9/F9).
  3. Press F9. Excel replaces that part of the formula with its result.

*Note: Since the content already exists, you could also double click in the cell to edit. Only difference is that F2 places your insert marker at the end of the contents, and wherever you double click, the insert displays at that point.

Use the Ribbon to Evaluate Formula

There is another way to evaluate a formula by each cell reference – Select the Formulas tab, Formula Auditing group and click on Evaluate formula icon to bring up the Evaluate dialog box.

Example of Evaluate Formula dialog box

Click Evaluate button to see formula results as you move through each cell reference. This is a great way to walk through a formula you are not too familiar with and/or someone else created and has you scratching your head.

Now you can know what is going on in your worksheet before you press Print or Send!

Let me know if you have used these features or how they can help you in the future…

Insert a Drop Cap in Microsoft Word

Why Use a Drop Cap?

The beauty of a drop cap

A drop cap can be fancy or plain but it catches the eye. Ever wonder how that novel you are reading displays a large, decorative dropped capital at the beginning of each chapter? Yep, that’s what it is – a great way to dress up a report, book, quote, invitation card, or any writing where you want to make a visual impact.

Word makes it very easy to insert a drop cap in any paragraph to add a little drama to your masterpiece! The drop cap is two lines by default but that can be customized.

Add a Drop Cap

  • Click anywhere in the paragraph where you want to apply the drop cap.
  • Click on the INSERT tab, in the Text group, drop down arrow on Drop Cap.

  • To insert a drop cap that fits within your paragraph, select Dropped.

  • To create a drop cap that is in the margin, outside of your paragraph, select In margin.

  • To change the font or size of the drop cap or adjust its distance from your text, choose Drop Cap Options at the bottom of the list. Experiment with some of the script fonts for variety and effect.

Remove a drop cap

  1. Click in the paragraph that contains the drop cap.
  2. Click on the INSERT tab, in the Text group, click Drop Cap | None.

Note: You can also create a drop cap in Outlook, using the same commands on the ribbon.

Might want to be a little careful with this one and not overuse it. It is a good design tool for the first paragraph of each chapter in a book. Could be applied more in other types of writing such as declarations, poetry or inspirational works, for example. Experiment with it, and your eye will tell you if you have overdone it!

How would you use this in what you create?