Trying to get more information out of that large spreadsheet? Functions such as VLOOKUP and SUBTOTAL are great summary tools but if your data changes frequently or you want to look at it in different ways, these 5 steps for a successful PivotTable will help you get great results.

Why Use a PivotTable?
PivotTables allow you to look at your data in a variety of ways that aren’t possible in the regular grid format of a worksheet. Set up properly, you can also instantly access “underneath” details that automatically display on a separate worksheet.
Prepare Data for PivotTables
You only get out of PivotTables what you put into them, so there are some key points to follow before clicking that Insert button to get the best results and avoid errors.
5 Steps to a Successful PivotTable start with making sure all the data is in the rawest form:
- Remove any blank columns or rows.
- Need a header row with a name in each column in the first row of the data. (Each column name becomes a field in the PivotTable). Always a good idea to format the row bold or italic to distinguish it from the data.
- Don’t mix data types in a column. You want only dates in Dates column, numbers in Sales column, text with text, etc.
- Don’t use detail data for column headings in source data, use “Year”, not “2020”, use “Month”, not “January”, etc.
- Convert the data range into an Excel Table before creating the PivotTable (not necessary but has added benefits). When rows are added to expand the original worksheet table, the PivotTable will automatically update to include them when you click Refresh. If created from a regular worksheet range, only data edited within that range gets updated in the PivotTable.*
Here’s a worksheet I converted to a Table:

Create the PivotTable
As a result, your worksheet is ready for primetime and creating the PivotTable:
- Click anywhere in the body of the data (if only using portion of worksheet, select that range first).
- Choose Insert tab and click the PivotTable icon in Tables group, to display a dialog box with your data range automatically selected. Placing it on a separate worksheet is also selected. (Can choose on same worksheet here if desired).
- Click OK and your new PivotTable Sheet is created.
Based on the above sample worksheet, this is the created PivotTable:

The PivotTable is now waiting for you to drag and drop the fields into the four area boxes at the bottom. Text columns would go in either Columns or Rows boxes and values such as sales or counts would go in the Values box.
Tweak the PivotTable
Here’s the PivotTable results after dragging Products into Columns, Salesperson into Rows and Sales into Values:

So now, from here you can add filters, create subsets of data, such as dragging Year below Salesperson in Rows box would display sales by year underneath each Salesperson, and so much more!
The main thing here is to start right with clean format and data so your PivotTable behaves. Make a copy of a worksheet and play. You will be amazed!
You can also use a great feature available since Excel 2010 called Slicers which are visual filters. A blog on this feature and more PivotTable wonders coming soon!
*Click here for my blog on Excel Tables: https://gaylelarson.com/magic-excel-tables/
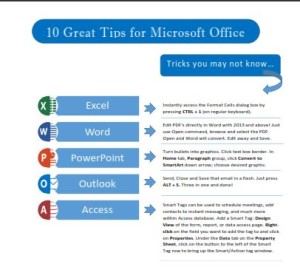
 Click to download great tips to speed up your Office projects.